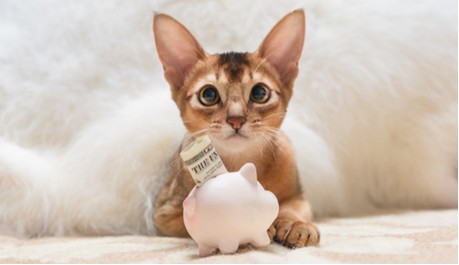
Millennials own the most pets, and are likely to own one in the future.
The figures for pet ownership are shown below.
• Millennials (23 years old to 38 years old) – 31 percent
• Baby Boomers (56 years old to 74 years old) – 29 percent
• Generation X (40 years old to 55 years old) – 26 percent
Have you ever wondered who owns the most pets and if any particular group of people own more than others?
Well, I’m going to cover this for you because there are age groups who own more pets than others. This can be for a variety of reasons, so I’ll cover those as well. The factors other than age are varied and constantly changing.
All Age Groups Own Pets
In most countries pet ownership is a part of the fabric of society. We spend time and money on our animal friends, and they become a part of the family. As our lives change, so do the patterns of pet ownership.
There is a connection between pets and their owners, and although pet ownership is spread across all age groups, our finances, family, travel, and jobs all play a part in whether people have pets and what type of pets they have.
In a recent survey, millennials were said to be the group with the most pet owners. Baby boomers followed this group, and then Generation X came in third.
The future of pet ownership is alive and well and will continue in the future. 43 percent of 18 to 34 year olds plan on having a pet in the future once their lifestyles suit it.
Dogs were the most common pets by far, with at least 50 million US households owning one. Cats were in second place, with just over 31 million households owning at least one cat.
Dogs were actually more popular than any other animals because the results were given per household. On average, the houses that had a dog as pets had 1.7 dogs.
An interesting trend is the increase of pet ownership among those over 70. A few years ago, just 34 percent of this age group had pets. That number has risen to around 40 percent.
If that trend continues, pet ownership overall will increase by large numbers.
Dogs and cats are by far the most popular pets, and according to the statistics above, millennials owned more than anyone, and many of them intend on owning a pet in the future.
The remaining popularity of pets was as follows:
- Fish
- Reptiles
- Other Mammals
- Rabbits
- Poultry
- Livestock
- Ferrets
It May Come Down to Money

As all pet owners know, owning a pet can be expensive. There are the daily costs of food, vets bills, and for some, daycare. There are also those unexpected but possible bills from sickness and surgery.
It’s likely that pet ownership is directly linked to the average income in all the surveyed age groups.
Pet costs differ greatly, but can be averaged out. The first year of dog and cat ownership exceeds $1000.00.
The annual cost for a dog can be anywhere up to $1170.00, and that’s if nothing goes wrong.
The annual cost for a cat can be up to $870.00.
It makes sense that at certain points in people’s lives they are more or less likely to have a pet. Younger people may be flusher with money with fewer overheads, but this may change when they buy houses or travel for work.
People who have children tend to have animals, but may change their pet habits when the kids leave home.
We all go through times when we have more money due to circumstances, and other times when we have less money. That’s why money relates to the likelihood of owning an animal, among other things.
All Age Groups Get Pets From Shelters

The general similarity for many age groups who get cats and dogs is the fact more people get their cats and dogs from shelters.
So, all age groups head to the shelter when it’s time to adopt a new pet.
- Animal Shelters: 31 percent of cats and 23 percent of dogs are adopted from shelters.
- Friends and Relatives: 28 percent of cats and 20 percent of dogs come from people the new owners know.
- Breeders: While only 3 percent of cats are from breeders, a bigger 34 percent of dogs are sourced in this way
One of the reasons millennials are getting pets in bigger numbers from all places is because they say it’s a good way to get ready for a family. They can prepare for responsibility, cost, and the emotional rollercoaster of both pets and family.
Owning a pet is at an all time high, and that is a good thing for all of us animal lovers.
Age Isn’t the Only Way to Measure Pet Ownership
Like all statistics, there are variations. While looking at what age group owns the most pets, you can also look at:
- Gender: American women spend less on their animals than men. This can be for a variety of reasons, but one possibility in that in a lot of industries, women still earn less than men.
Men spend on average $137.00 per month, while women spend slightly less at $117.00 per month.
- Relationship Status: People spend amounts on their pets based on their relationship status. The biggest spenders are from highest to lowest:
1. Married people
2. Single People
3. Living with a Partner
4. Widowed
5. Divorced
6. Separated
Interestingly, Iphone users spend more on their pets per month than Android users. So as you can see, we can break pet ownership down by age, but multiple factors can affect those statistics.
Other Pets are Spread Over All Age Groups Too

Of course there are more to pets than just cats and dogs. It’s estimated that living with Americans are 116 million fish, reptiles, and other small animals.
This is where the younger age group join the older ones in pet ownership.
- 90 percent of households that have hamsters have children: Of those numbers, 87 percent have children under the age of 12.
- 60 percent of households with fish have children under 18: This is also the case for rabbits, reptiles, and other small animals.
- Most pets are owned by multiple ages at the same time:85 million families own a pet. Given these numbers, it is clear that many pets reside with families made up of people of various ages, from very young children to older adults. All of these people may consider the pet to be theirs equally.
Millennials Spend More on Pets
Milliennials spend more on their pets than older age groups, and the theory behind their importance in the market is they are younger people with younger pets; therefore they will need to buy more accessories and toys over time.
A huge number of millennials buy a gift for ther pets at least once a month.
Millennials also buy product that previously wasn’t popular. 83 percent buy clothing that doubles as pet carriers like pet pooch hoodies and slings.
Millennials buy clothes for their pets in bigger numbers than any other generation, and buy clothing more often at special occasions like Halloween.
Retailers all over the United States note an increase in spending from millennials, especially online niche products, and even pet food via the internet.
Age is an important measurement for determining who owns pets, but there are so many other factors that sit alongside the owner’s age, so the pet owning landscape is ever-changing. Either way you look at it, pet ownership is and always will be popular.
Writer: Craig Taylor

Sources
https://www.worldatlas.com/articles/the-most-popular-animals-owned-as-pets-in-the-us.html
https://www.aspca.org/animal-homelessness/shelter-intake-and-surrender/pet-statistics
https://www.healthypawspetinsurance.com/blog/2017/09/29/pet-parenthood-shifting-demographic
https://www.petfoodindustry.com/articles/7255-survey-examines-us-pet-ownership-demographics
https://www.iii.org/fact-statistic/facts-statistics-pet-statistics

